
Beginner to AdvancedEnglish

Excel Dashboard Masterclass

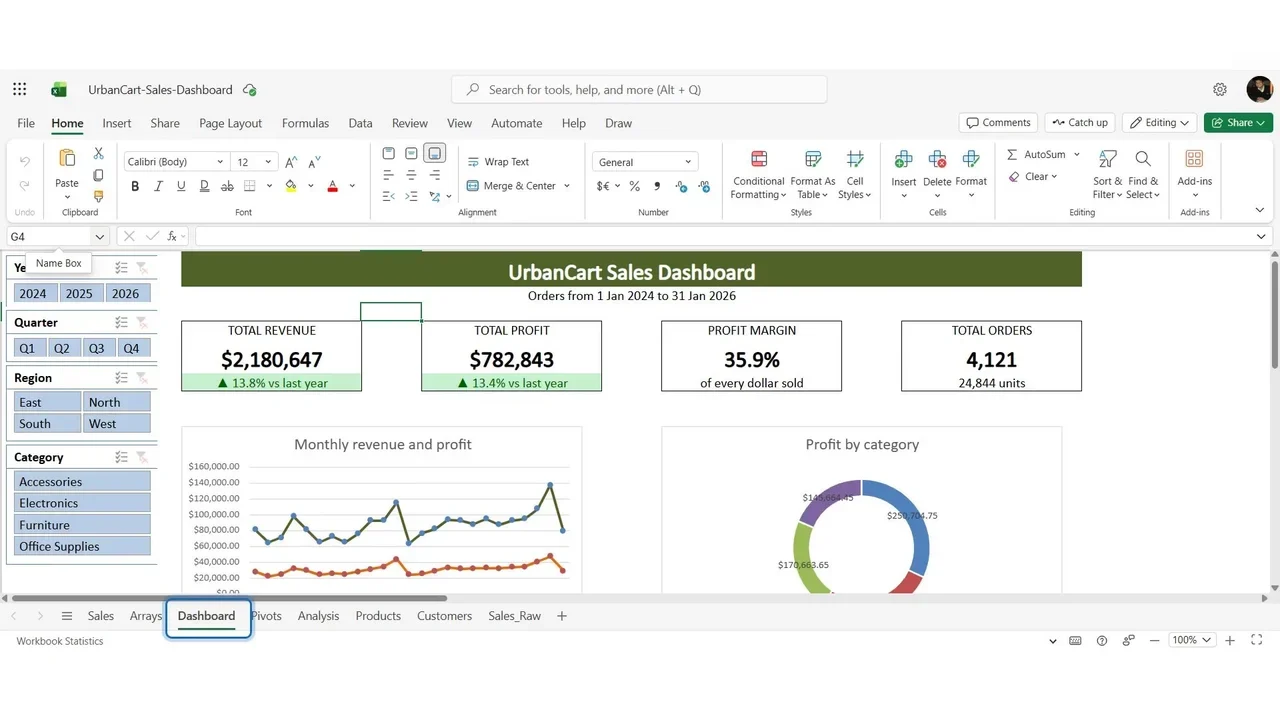
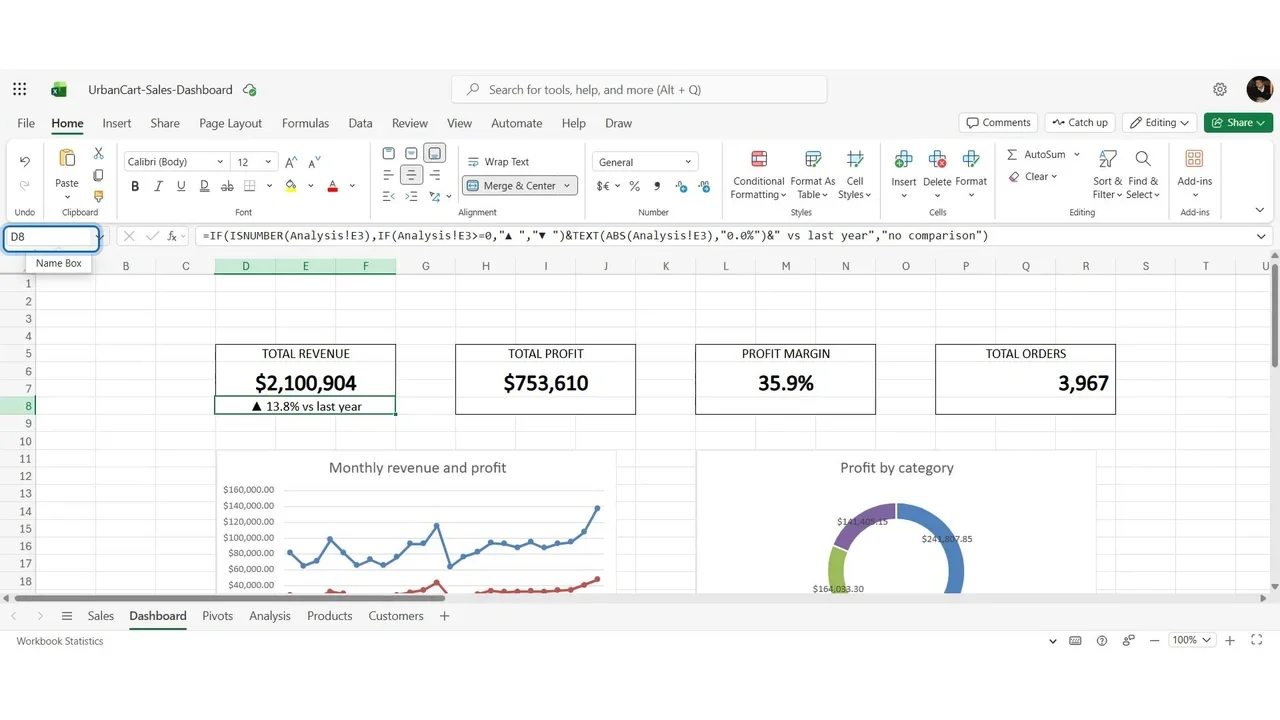
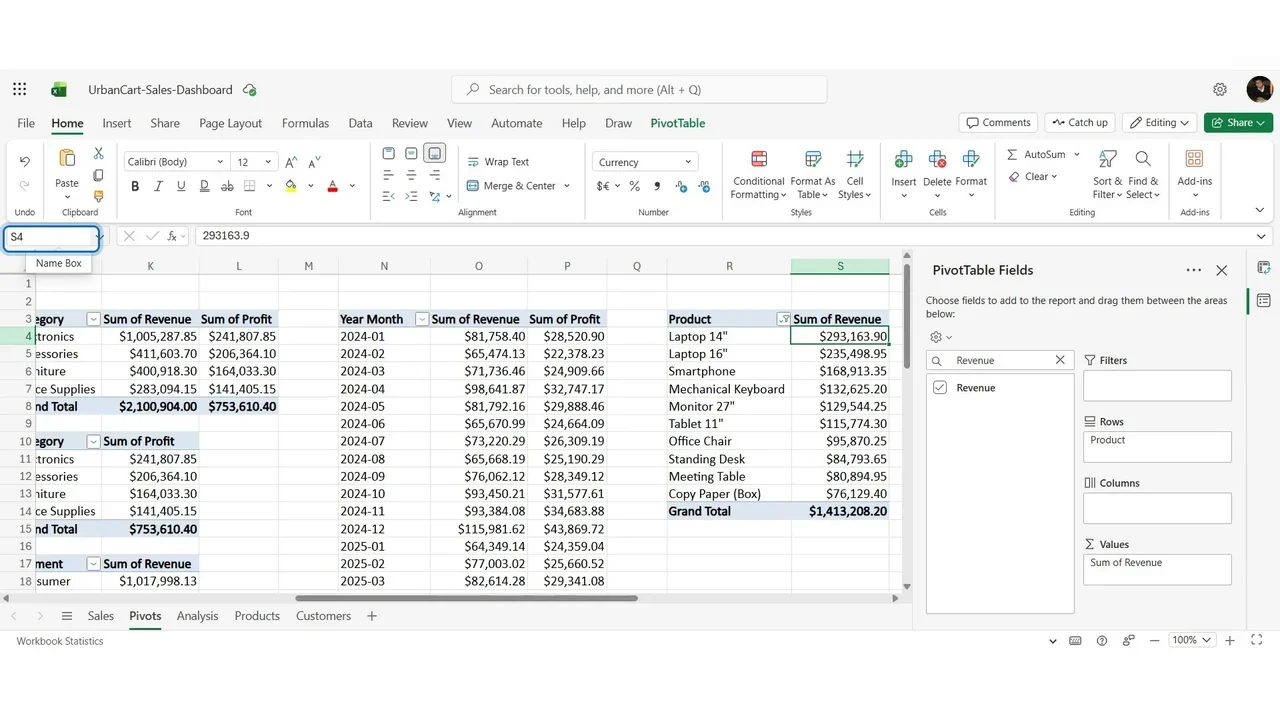
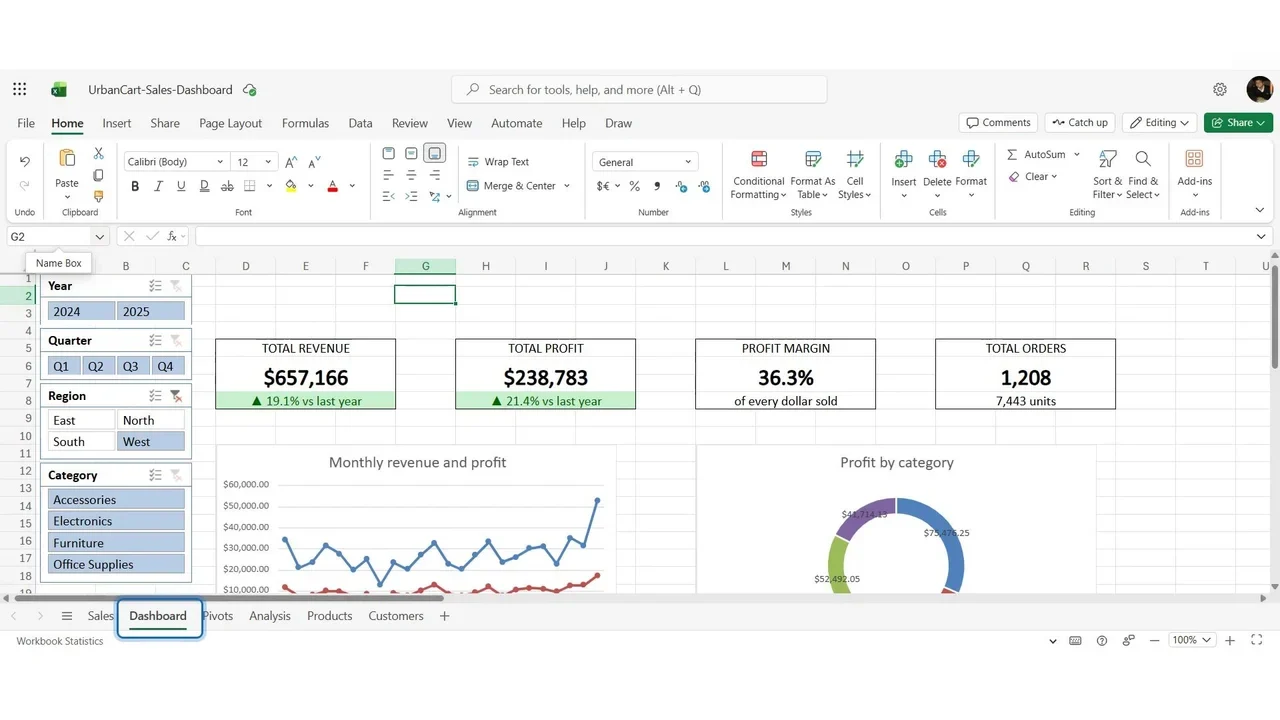
Turn four thousand rows of messy sales data into an interactive dashboard a manager reads in ten seconds: cleaning, XLOOKUP and SUMIFS, PivotTables, charts, KPI cards and slicers.

  • 11 videos
  • 1.4 h of video

Plays the full course playlist from YouTube in privacy-enhanced mode. Nothing loads from YouTube until you press play.

About this course

Build a professional, interactive sales dashboard in Microsoft Excel, from four thousand rows of raw, messy data to a dashboard a manager can read in ten seconds. Hands-on from the first minute, in Excel for the web.

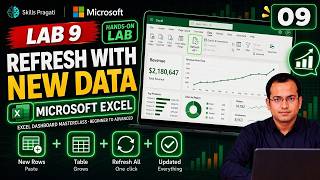
Overview and demo, then ten labs: 0. Set up the workbook 2. Clean the data 3. Formulas: XLOOKUP, SUMIFS, IF, IFERROR 4. PivotTables 5. Charts 6. KPI cards 7. Slicers 8. Design 9. New data and one refresh 10. Final project, plus bonus modules on Power Query and dynamic arrays (Lab 1 is a short reading in the lab guide.)

Practice simulation

Practise every lab in your browser

8 labs and 109 steps rebuilt from the course videos. Practise each step with voice guidance, switch on Exam mode to test yourself, or press Watch to see the lab play. The first lab is free; the rest come with a subscription.

Try the free lab
  1. Lab 0 · Set Up the Workbook in OneDrive Free

    1 section · 9 steps · 3 to click

    Practise
  2. Lab 2 · Clean Messy Data in Excel - Tables, Duplicates, Text Dates Subscribers

    3 sections · 36 steps · 12 to click

    Practise
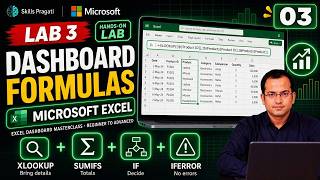
  3. Lab 3 · The Formulas a Dashboard Needs - XLOOKUP, SUMIFS, IF, IFERROR Subscribers

    1 section · 6 steps · 1 to click

    Practise
  4. Lab 4 · PivotTables for Dashboards - Step by Step Subscribers

    2 sections · 16 steps · 4 to click

    Practise
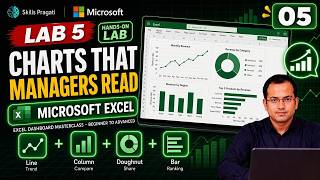
  5. Lab 5 · Charts That Managers Can Read - Line, Column, Doughnut, Bar Subscribers

    2 sections · 14 steps · 5 to click

    Practise
  6. Lab 6 · KPI Cards With GETPIVOTDATA and Conditional Formatting Subscribers

    2 sections · 13 steps · 6 to click

    Practise
  7. Lab 7 · Slicers - Make the Dashboard Interactive Subscribers

    1 section · 4 steps · 1 to click

    Practise
  8. Lab 10 · Final Project + Bonus - Power Query and Dynamic Arrays Subscribers

    1 section · 11 steps · 4 to click

    Practise
Leader brief

What a technology leader should know about Excel Dashboard Masterclass

What it is

An Excel dashboard turns thousands of rows of raw, messy data into a one-page view a manager can read in ten seconds, refreshed with new data in one step.

Why now

Most business reporting still lives in Excel; a clean, interactive dashboard replaces manual weekly reports without new software.

Decisions you will make

  • Which KPIs belong on the one page
  • Cleaning rules for raw exports
  • How new data is added and refreshed

Risks if ignored

  • Decisions made on inconsistent numbers
  • Hours lost rebuilding the same report every week

Cost

Free: Excel for the web with a free Microsoft account is enough.

Who owns what

AnalystData cleaning, formulas, PivotTables and the dashboard
ManagerChoosing the KPIs and acting on them

Questions to ask your team

  • Which three numbers do we look at every week?
  • How long does the weekly report take to build?

More in Excel & Productivity

Excel & ProductivityBeginner to AdvancedHindi

Advanced Excel Masterclass in Hindi

Twenty hands-on labs in Hindi, from tables and formulas to Power Query and M, Power Pivot and DAX, what-if models, forecasting, AI-assisted Excel and a complete BI dashboard.

  • Hands-on lab
  • Practice sim
  • Mock exam

22 videos3.5 h17 practice labs

Watch on YouTube