

Excel Dashboard Masterclass Step by step · Lab 7
One Click Filters Everything: Excel Slicers for Dashboards
Add Year, Quarter, Region and Category slicers, connect them to every PivotTable, and test that one click filters every card and chart.

The dashboard shows the whole business. A manager wants to ask: and the West alone? And furniture, in 2025? A slicer answers that with one click. In Lab 7 we add four, and connect them so every number follows.
One thing to know about Excel for the web
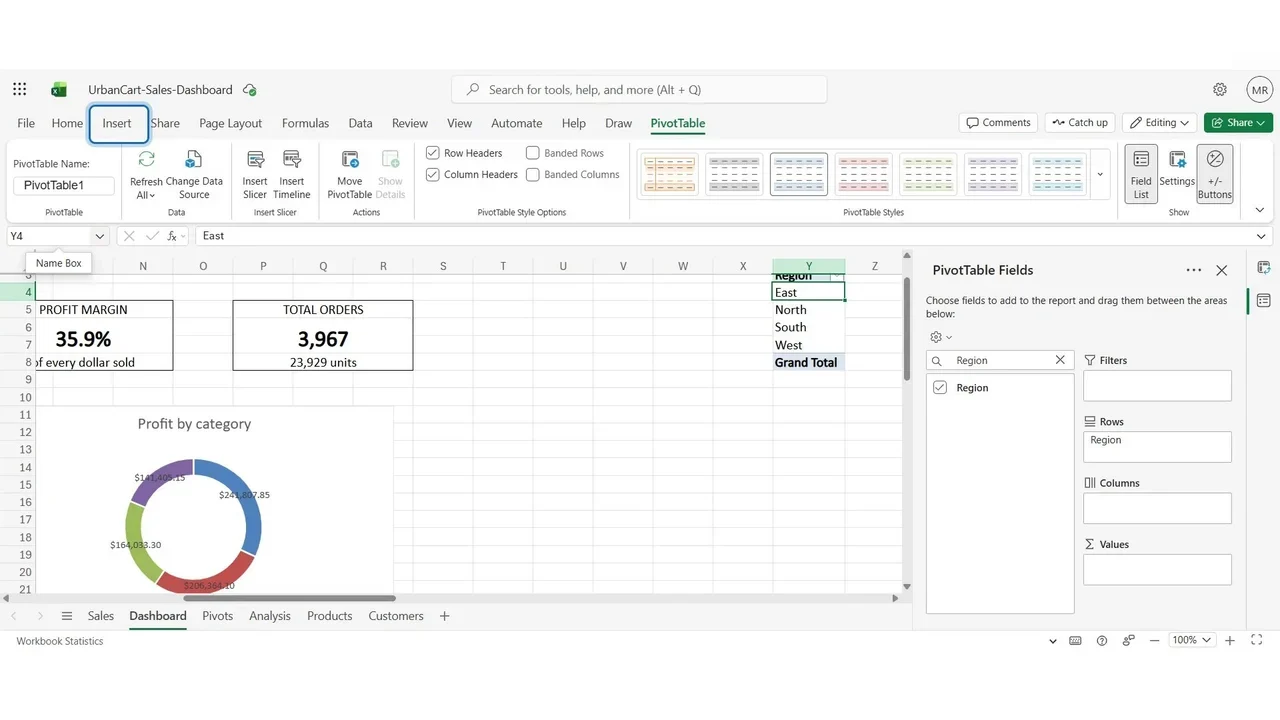
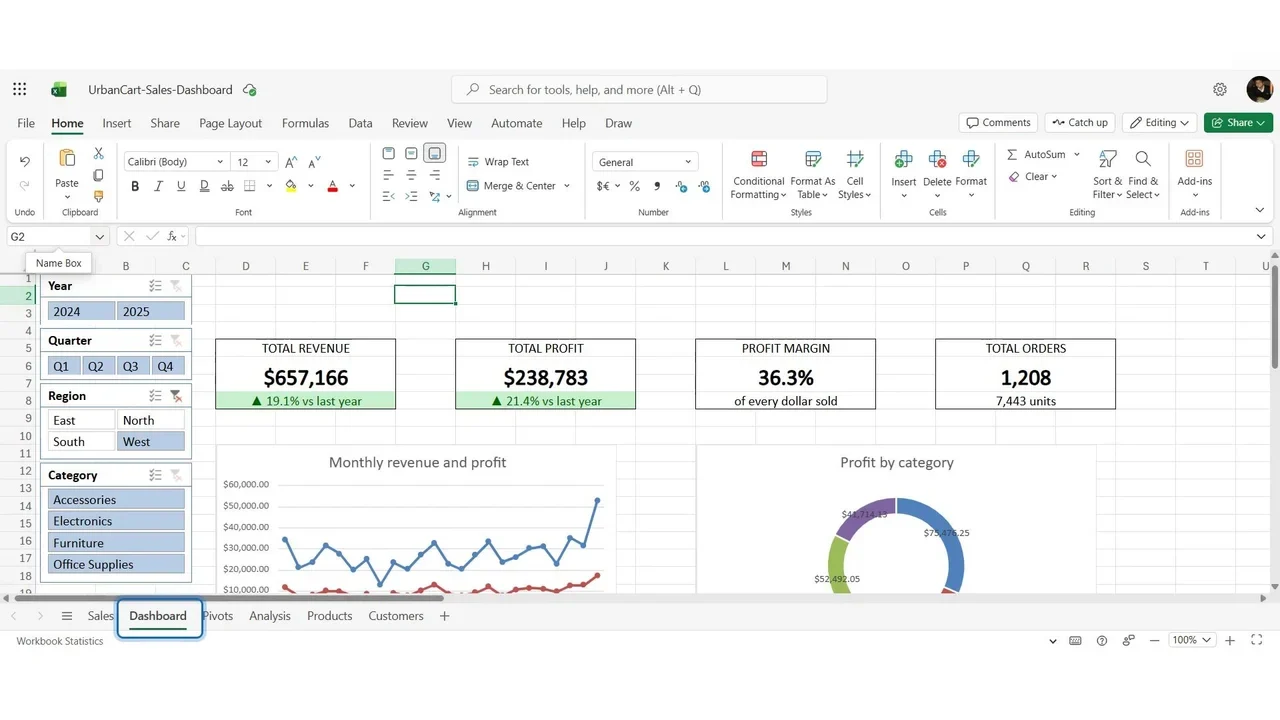
In Excel for the web, a slicer is created on the sheet of the PivotTable you insert it from, and cannot be moved to another sheet. So we add a small helper PivotTable on the Dashboard sheet itself (at Y3, with Region in Rows) and insert the slicers from it.
Step 1: Insert the slicers
Select a cell of the helper PivotTable, Insert → Slicer, and tick Year, Quarter, Region and Category.
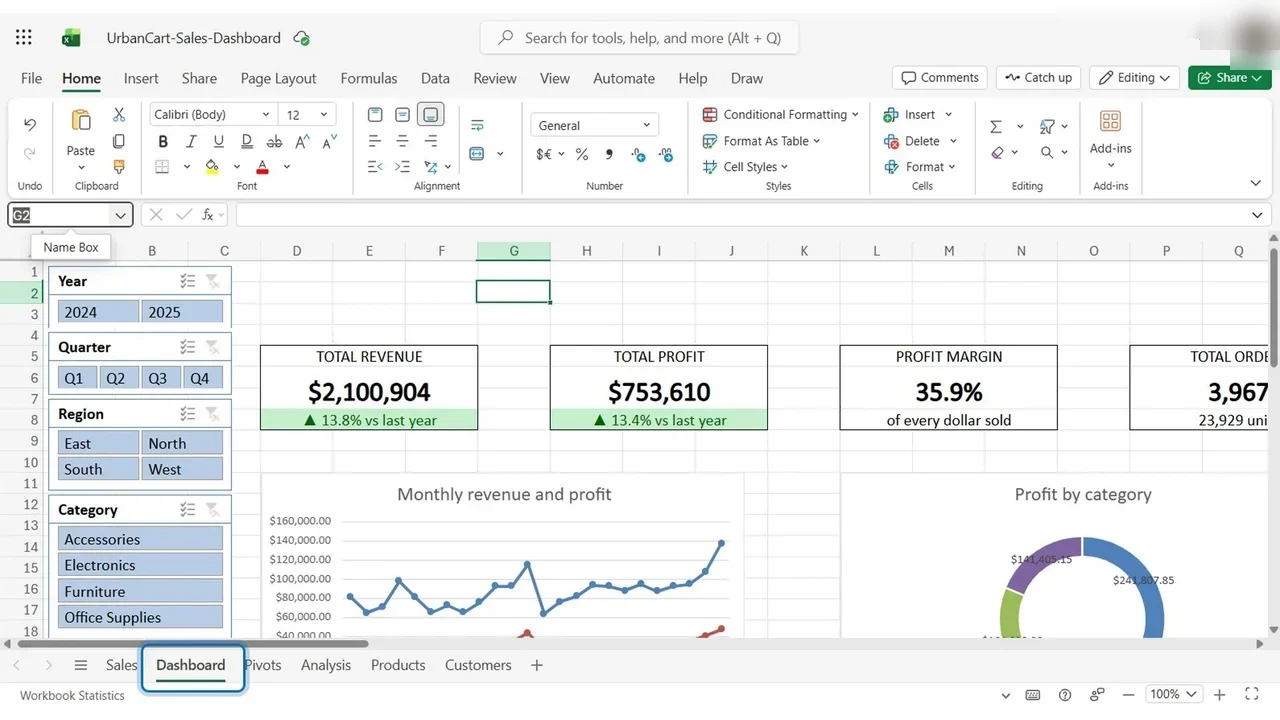
For each slicer: right-click, Slicer Settings, then the number of buttons per row, the size and the position. Line them up at the left of the cards.
Step 2: Connect them to every PivotTable
A slicer filters only the PivotTables it is connected to; so far that is just the helper. Open each slicer’s PivotTable Connections and tick the others: KPI, Region, Category, Category Profit, Segment and Top.
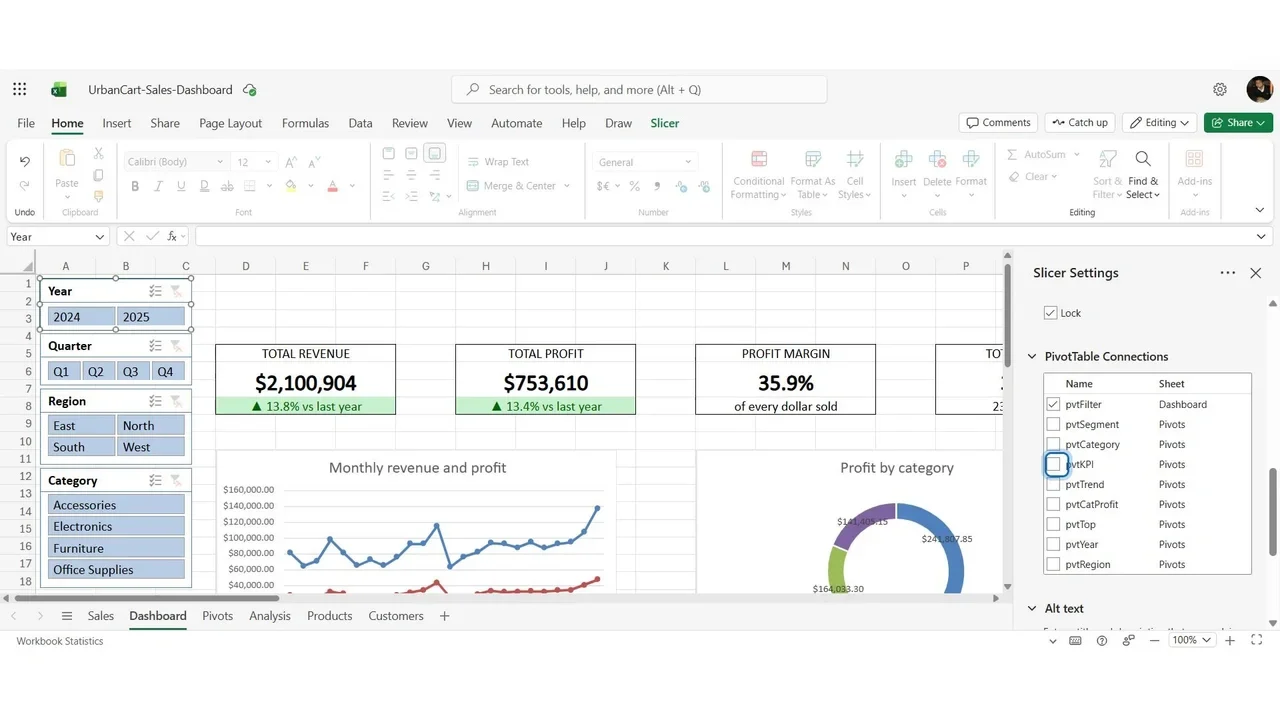
One design decision: the Region slicer is not connected to the revenue-by-region PivotTable, because a region chart that shrinks to one column when you pick a region tells nothing.
How you know it worked
Select West: every card changes at once, revenue $657,166, and the trend and doughnut show the West only.
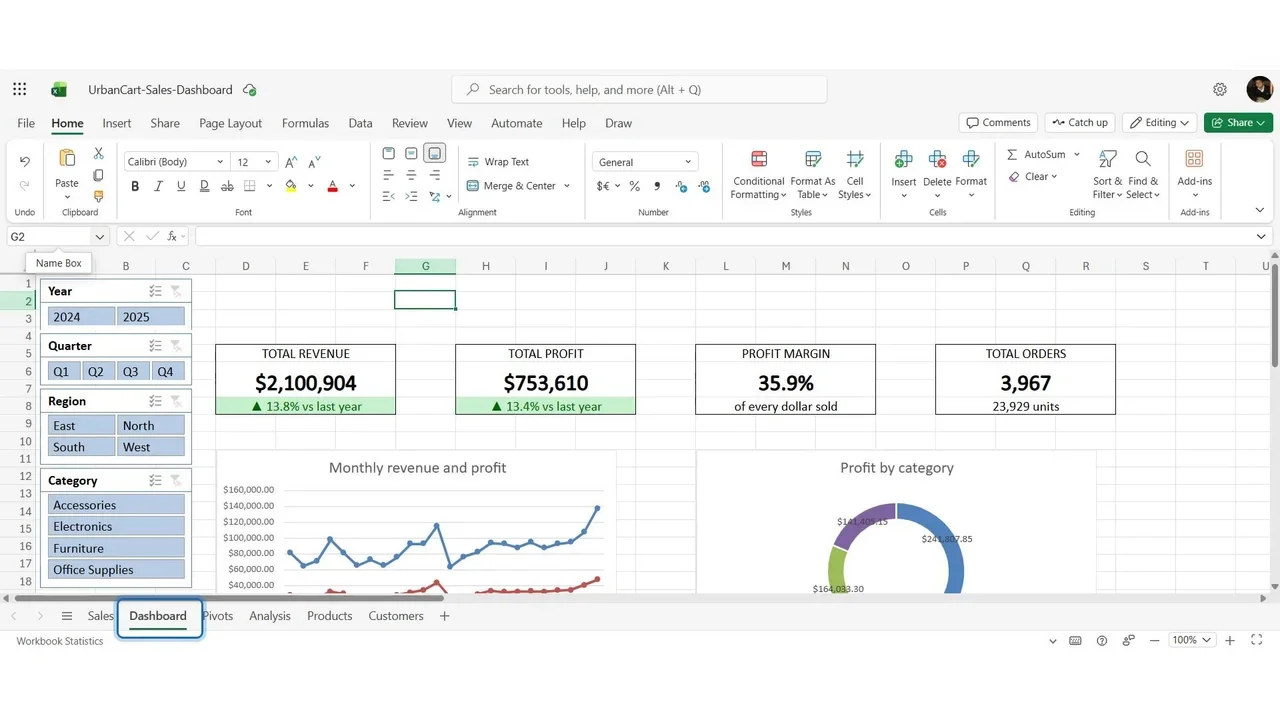
Add 2025 in the Year slicer: West in 2025 is $357,196, the number calculated by hand with SUMIFS in Lab 3. The dashboard and the independent formula agree.
Handy to know
- Ctrl + click selects two buttons, for example West and East.
- Clear Filter (right-click, or the funnel at the slicer’s corner) brings the whole business back.
- A timeline filter for dates can only be created in the desktop app; in the browser, Year and Quarter slicers do the job.
Do it yourself
- The full Excel Dashboard Masterclass courseEvery Part, free on YouTube, in order
- Hands-on lab guideThe exact steps, what it costs, how to clean up
- Practice simulationRehearse every click in your browser; the first lab is free
- Mock examFree 10-question sample, then the full timed mock scored by domain
Lab guides, practice and full mock exams come with a subscription. See the plans