

Excel Dashboard Masterclass Step by step · Lab 6
Build 4 Excel KPI Cards With GETPIVOTDATA
Build four KPI cards that read a PivotTable with GETPIVOTDATA, add this-year-vs-last-year, and colour them with tested conditional formatting.

A dashboard opens with a few big numbers. But a number alone says little: two point one million is good news only if last year was lower. In Lab 6 we build four KPI cards, each with a label, a value and a line of context, coloured by rules.
Step 1: A card that reads the PivotTable
A card is a few formatted cells. Merge D5:F5 for the label (Total revenue), and D6:F7 for the value. The formula does not add up the table; it reads the PivotTable:
=GETPIVOTDATA("Sum of Revenue", Pivots!$E$3)
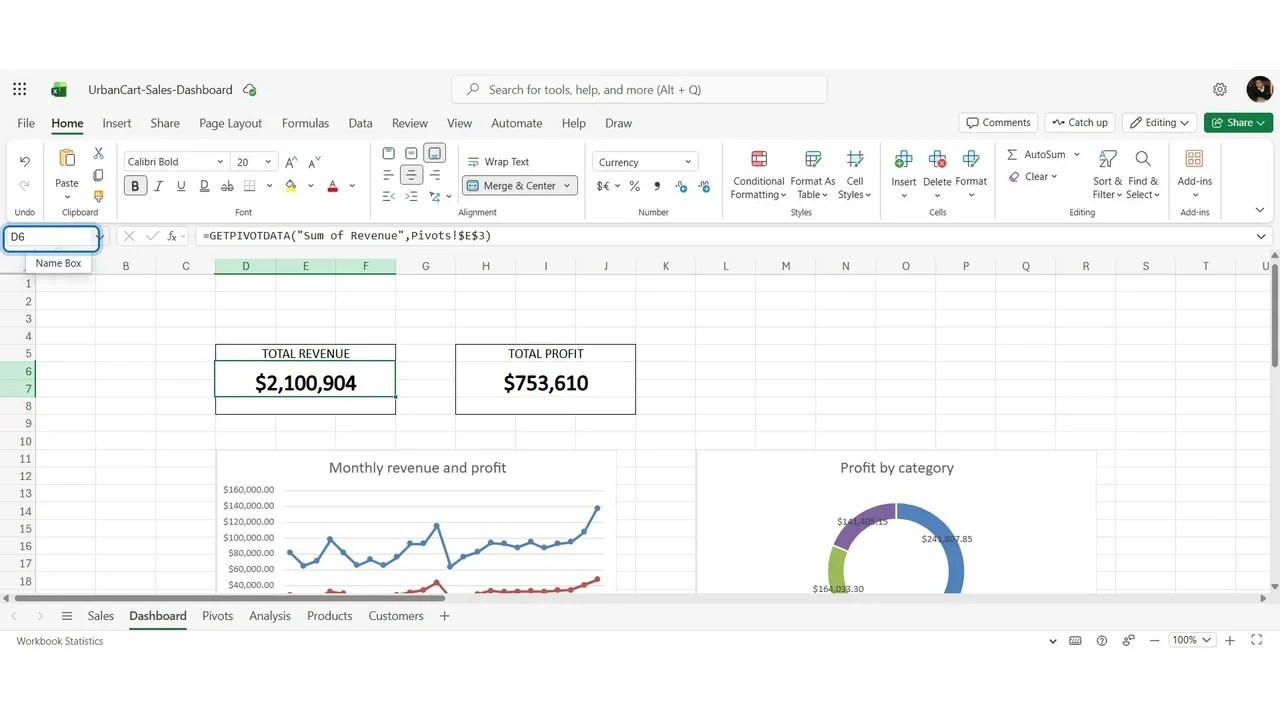
Format it as a headline: currency, no decimals, 20 points, bold, a thin border.
Step 2: Four equal cards
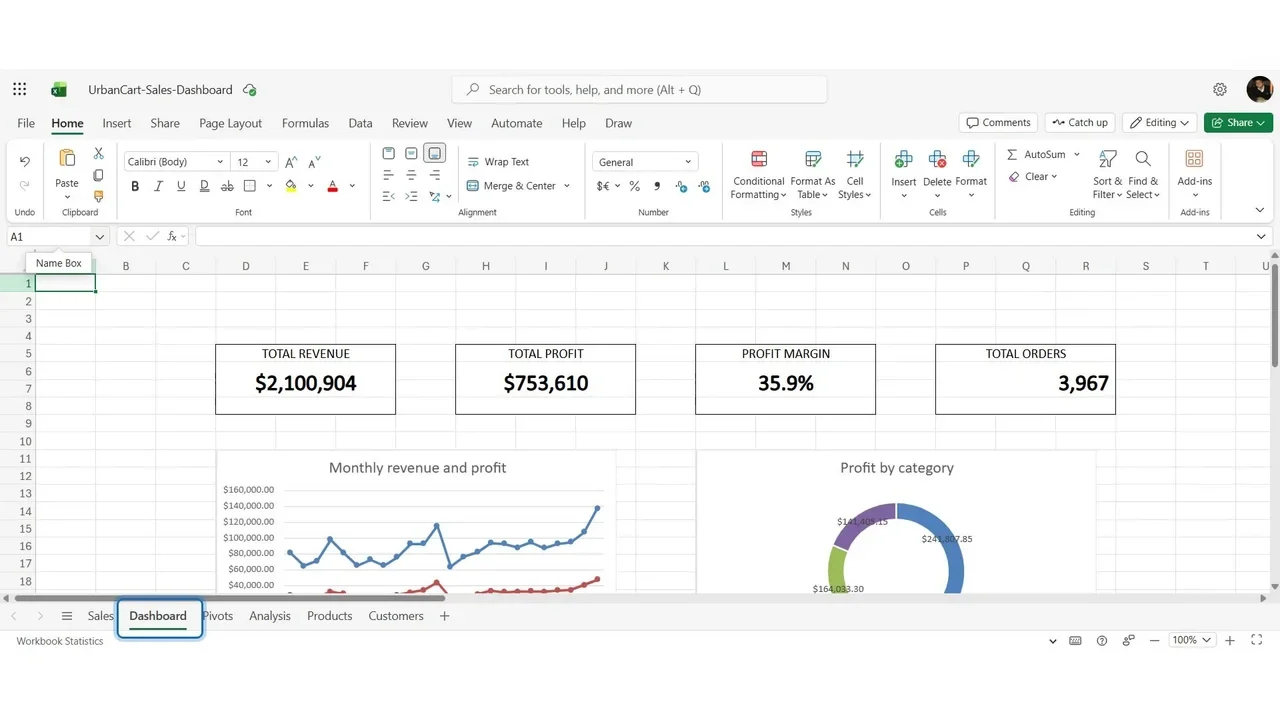
Profit uses the same formula with Sum of Profit. The margin card needs no PivotTable: profit divided by revenue, inside IFERROR so an empty filter shows nothing instead of an error. Orders uses Count of Order ID with a comma style.
Step 3: This year against last year
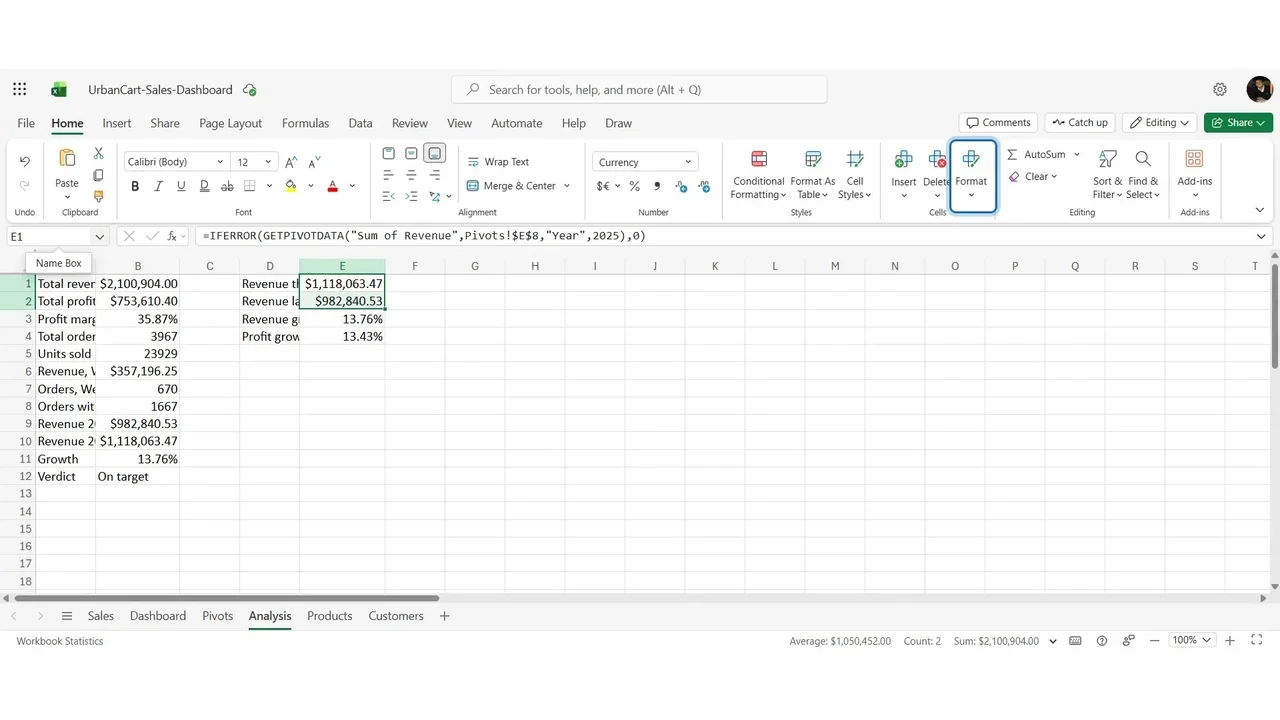
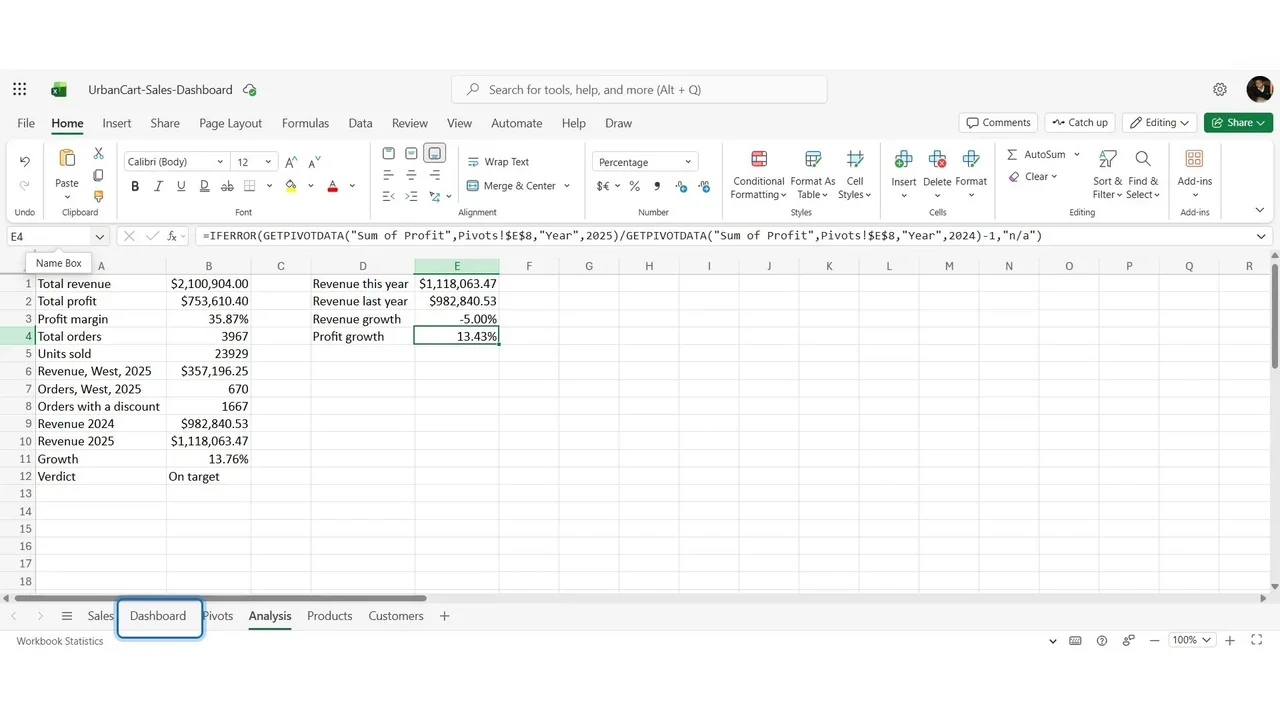
The comparison is a calculation, so it belongs on the Analysis sheet: revenue this year and last year with GETPIVOTDATA filtered by Year, then growth = this year ÷ last year − 1. Revenue grew 13.8%.
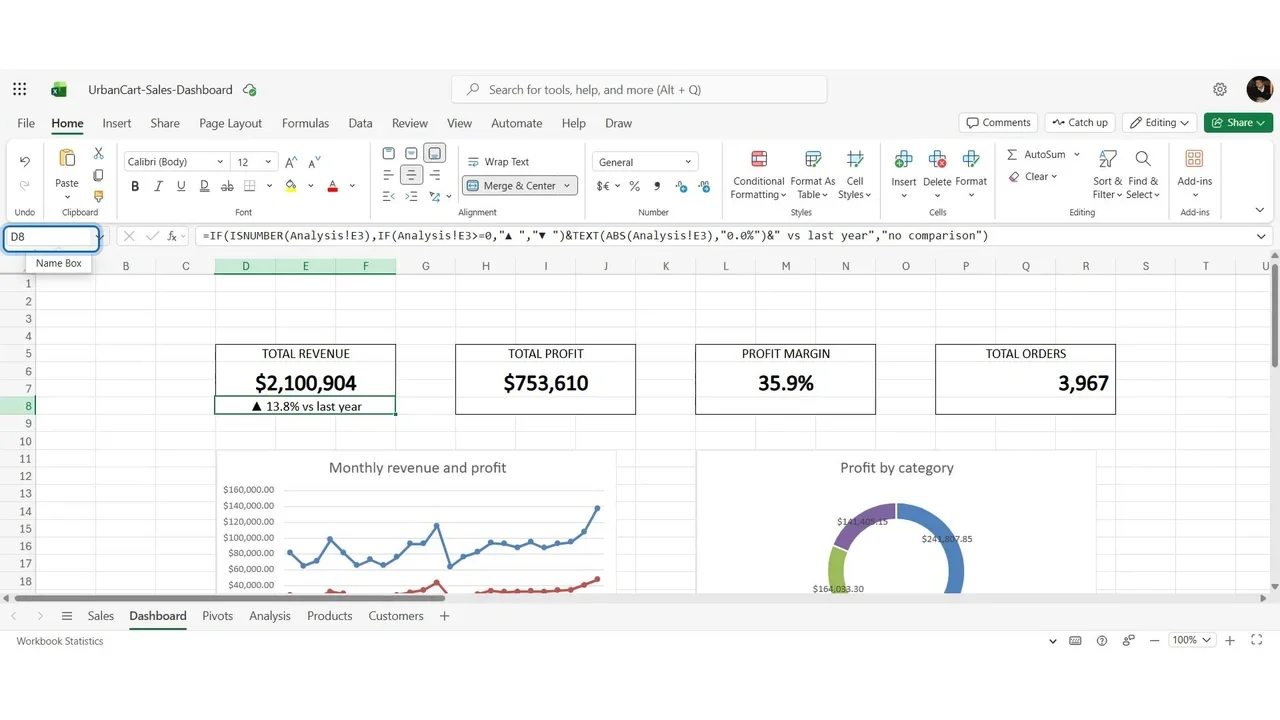
Back on the card, row 8 builds a sentence: an arrow (up when growth is zero or more, down when negative), the percentage, and vs last year.
Step 4: Green and red, by rule
Conditional Formatting → Highlight Cell Rules → Text that Contains the up arrow: green. A second rule for the down arrow: red. And a rule on the margin: less than 30%, red.
How you know it worked
Never trust a rule you have not seen fire. On Analysis, type −5% over the revenue growth for a moment: on the dashboard the arrow turns down and the line turns red. Then put the formula back.
The arrow matters as much as the colour: about one man in twelve does not see the difference between red and green, and the card must still read correctly for them.
Do it yourself
- The full Excel Dashboard Masterclass courseEvery Part, free on YouTube, in order
- Hands-on lab guideThe exact steps, what it costs, how to clean up
- Practice simulationRehearse every click in your browser; the first lab is free
- Mock examFree 10-question sample, then the full timed mock scored by domain
Lab guides, practice and full mock exams come with a subscription. See the plans