

Excel Dashboard Masterclass Course guide
4,000 Messy Rows to a 10-Second Excel Dashboard
Turn four thousand rows of messy sales data into an interactive Excel dashboard a manager reads in ten seconds, in Excel for the web, lab by lab.

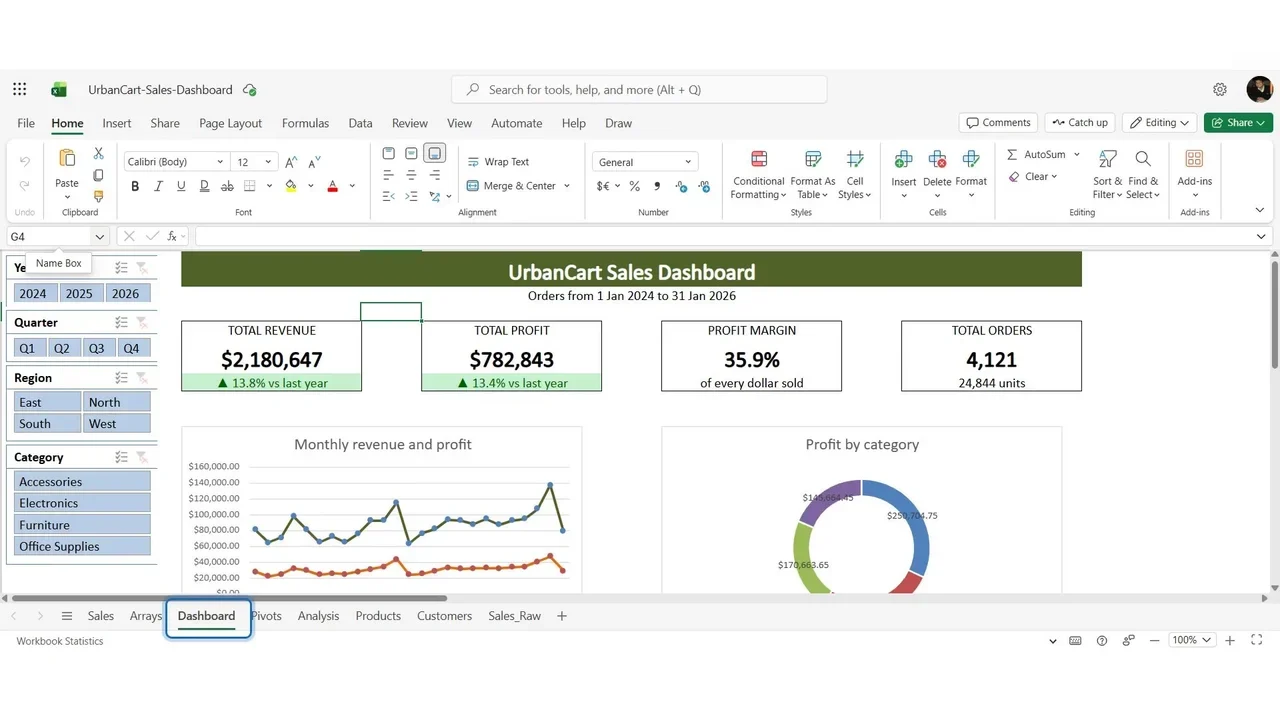
A good dashboard answers a manager’s question in ten seconds. In this course you take about four thousand rows of raw, messy sales data and turn them into an interactive dashboard: four key numbers at the top, each compared with last year, filters at the left, and one chart per question.
What you will be able to do
- Clean raw data: duplicates, missing values and dates typed as text, turned into a table.
- Write the formulas a dashboard needs: XLOOKUP, SUMIFS, IF and IFERROR.
- Summarise thousands of rows with PivotTables, and show each result in the right chart.
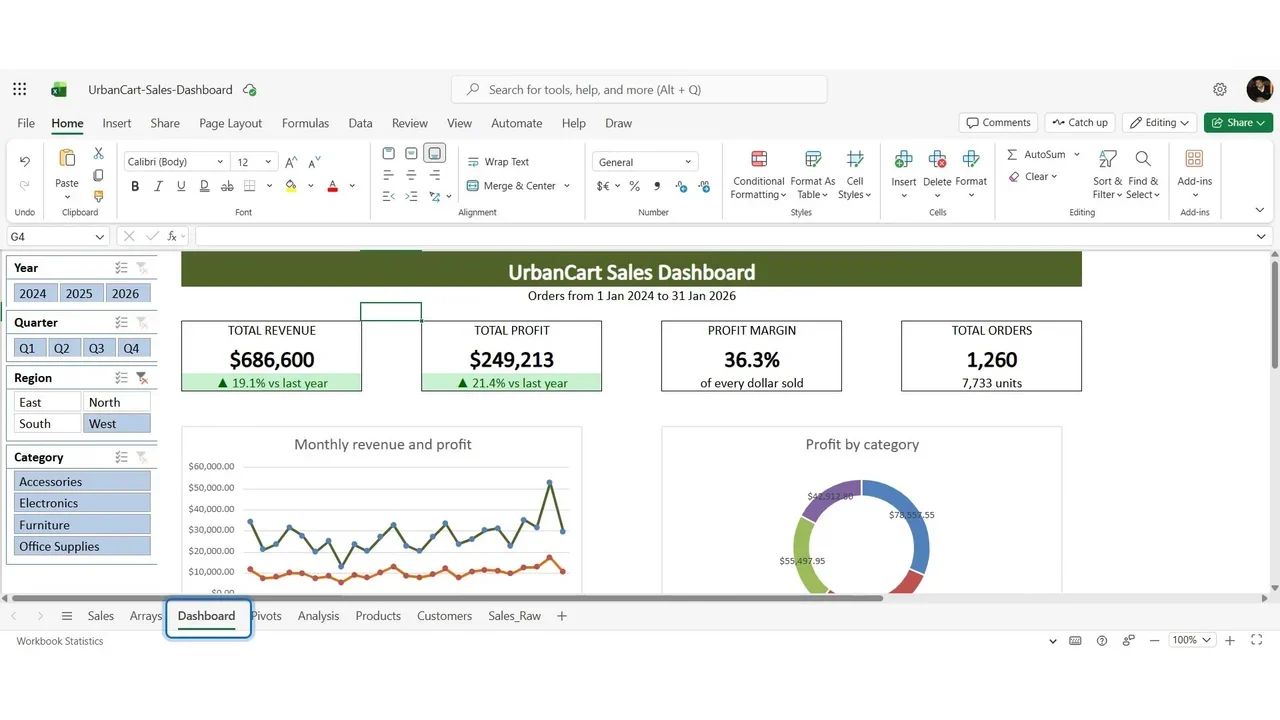
- Build KPI cards and slicers, so one click filters every number and every chart.
- Design, refresh, validate and share the dashboard.
The road, lab by lab
- Lab 0: set up the workbook in OneDrive.
- Lab 2: clean the messy data.
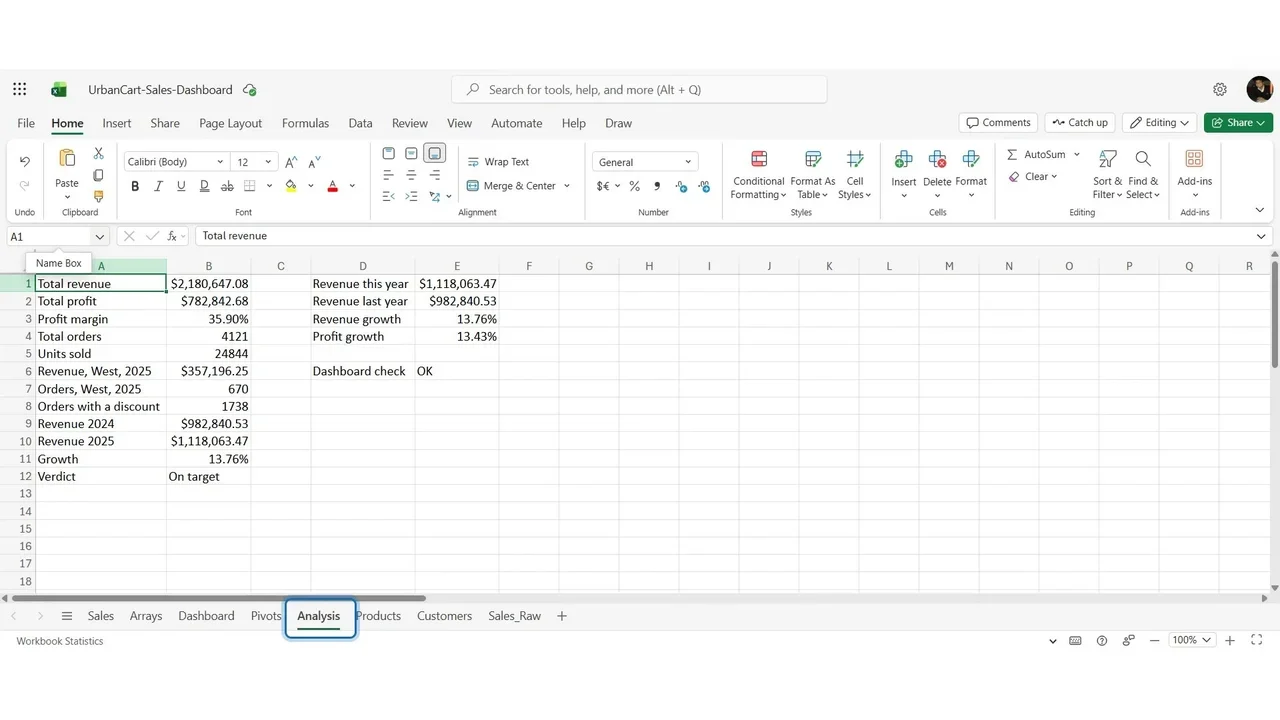
- Lab 3: formulas, and an Analysis sheet whose results later prove the dashboard is right.
- Lab 4: PivotTables, one per question. Lab 5: charts.
- Lab 6: KPI cards against last year. Lab 7: slicers. Lab 8: design.
- Lab 9: new data in one refresh. Lab 10: the final project, plus bonus modules on dynamic arrays and Power Query.
What you need
A browser. The course works in Excel for the web, free with a Microsoft account. A lab guide with every step and the expected result, and the data files, come with the course.
The full course is free on YouTube
The overview above is the first of 11 videos. Start with Lab 0 and build along.
Do it yourself
- The full Excel Dashboard Masterclass courseEvery Part, free on YouTube, in order
- Hands-on lab guideThe exact steps, what it costs, how to clean up
- Practice simulationRehearse every click in your browser; the first lab is free
- Mock examFree 10-question sample, then the full timed mock scored by domain
Lab guides, practice and full mock exams come with a subscription. See the plans