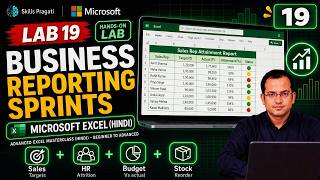
Beginner to AdvancedHindi

Advanced Excel Masterclass in Hindi

Twenty hands-on labs in Hindi, from tables and formulas to Power Query and M, Power Pivot and DAX, what-if models, forecasting, AI-assisted Excel and a complete BI dashboard.

  • 22 videos
  • 3.5 h of video

Plays the full course playlist from YouTube in privacy-enhanced mode. Nothing loads from YouTube until you press play.

About this course

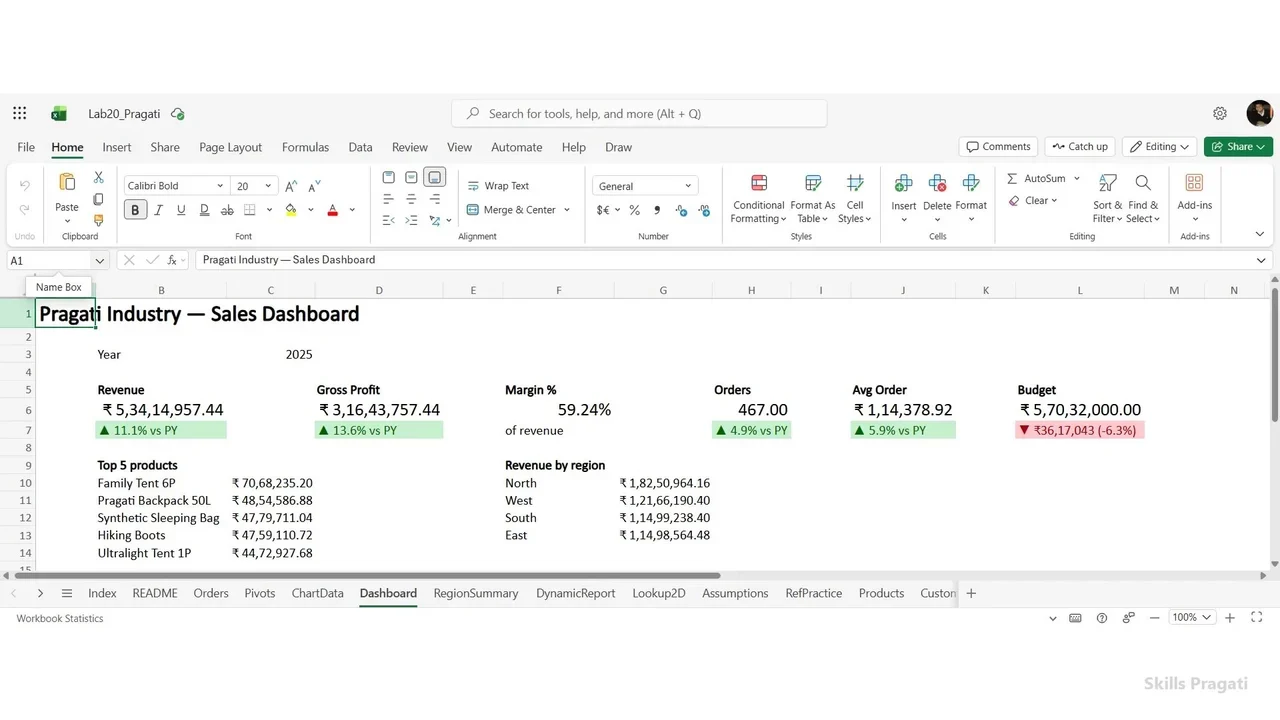
Advanced Excel in Hindi, step by step, on one company's data: Pragati Industry. Twenty hands-on labs in Excel for the web, from tables and formulas to Power Query, PivotTables, DAX, what-if models and a complete BI dashboard.

Course overview and demo, then: 0. Course folder and practice workbook 1. Tables and references 2. Clean messy data 3. Logical functions 4. Lookups (XLOOKUP) 5. Text, date and SUMIFS 6. Dynamic arrays 7. Advanced PivotTables 8. Advanced charts 9. Dashboard design 10. Power Query 11. Advanced Power Query and M 12. Power Pivot and the data model 13. DAX measures 14. Macros, VBA and Office Scripts 15. What-if analysis 16. Statistics and forecasting 17. AI-assisted Excel 18. Auditing 19. Business reporting sprints 20. Capstone BI dashboard

Practice simulation

Practise every lab in your browser

17 labs and 362 steps rebuilt from the course videos. Practise each step with voice guidance, switch on Exam mode to test yourself, or press Watch to see the lab play. The first lab is free; the rest come with a subscription.

Try the free lab
  1. Lab 0 · Course Folder and Practice Workbook in OneDrive Free

    1 section · 14 steps · 2 to click

    Practise
  2. Lab 1 · Excel Tables, Calculated Columns, Named Ranges and $ References Subscribers

    3 sections · 48 steps · 20 to click

    Practise
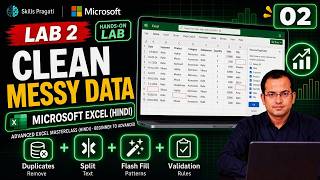
  3. Lab 2 · Clean Messy Data - Remove Duplicates, Flash Fill, Data Validation Subscribers

    4 sections · 43 steps · 9 to click

    Practise
  4. Lab 3 · IF, IFS, SWITCH and LET - Business Rules in Formulas Subscribers

    3 sections · 28 steps · 9 to click

    Practise
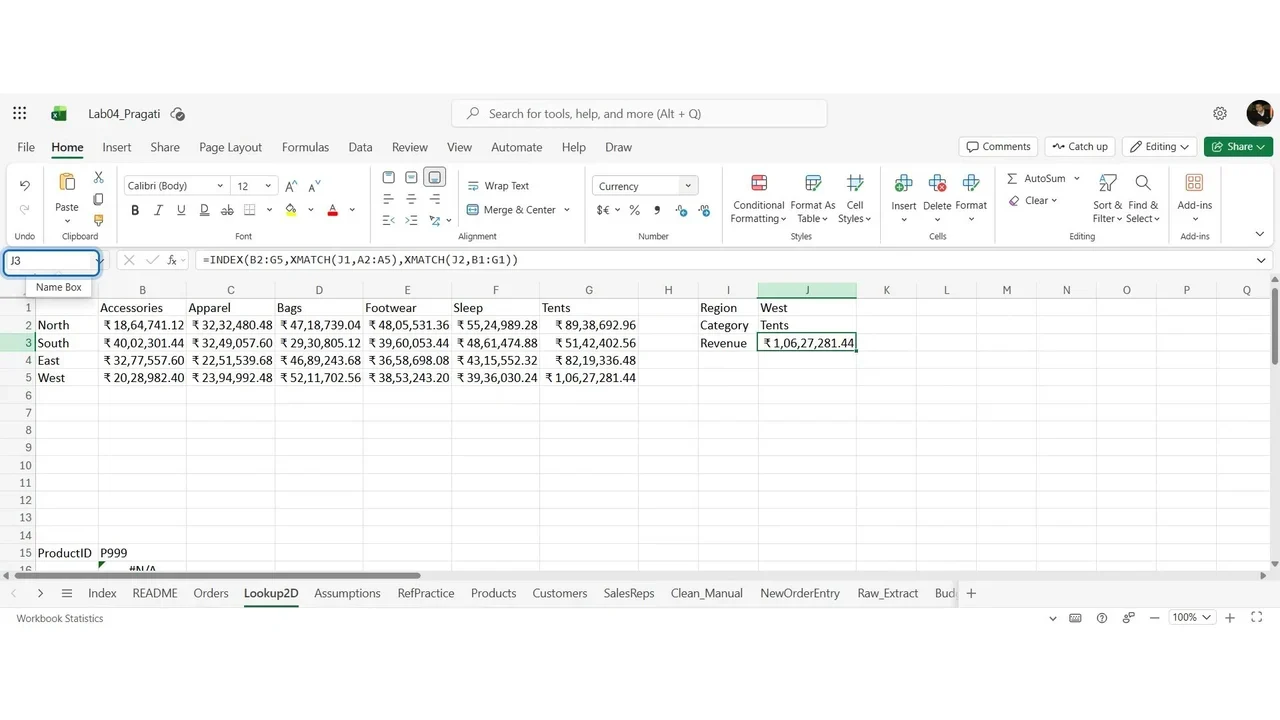
  5. Lab 4 · XLOOKUP, INDEX MATCH and Two-Way Lookups Subscribers

    3 sections · 26 steps · 9 to click

    Practise
  6. Lab 5 · Text, Date and SUMIFS / COUNTIFS Functions Subscribers

    4 sections · 29 steps · 8 to click

    Practise
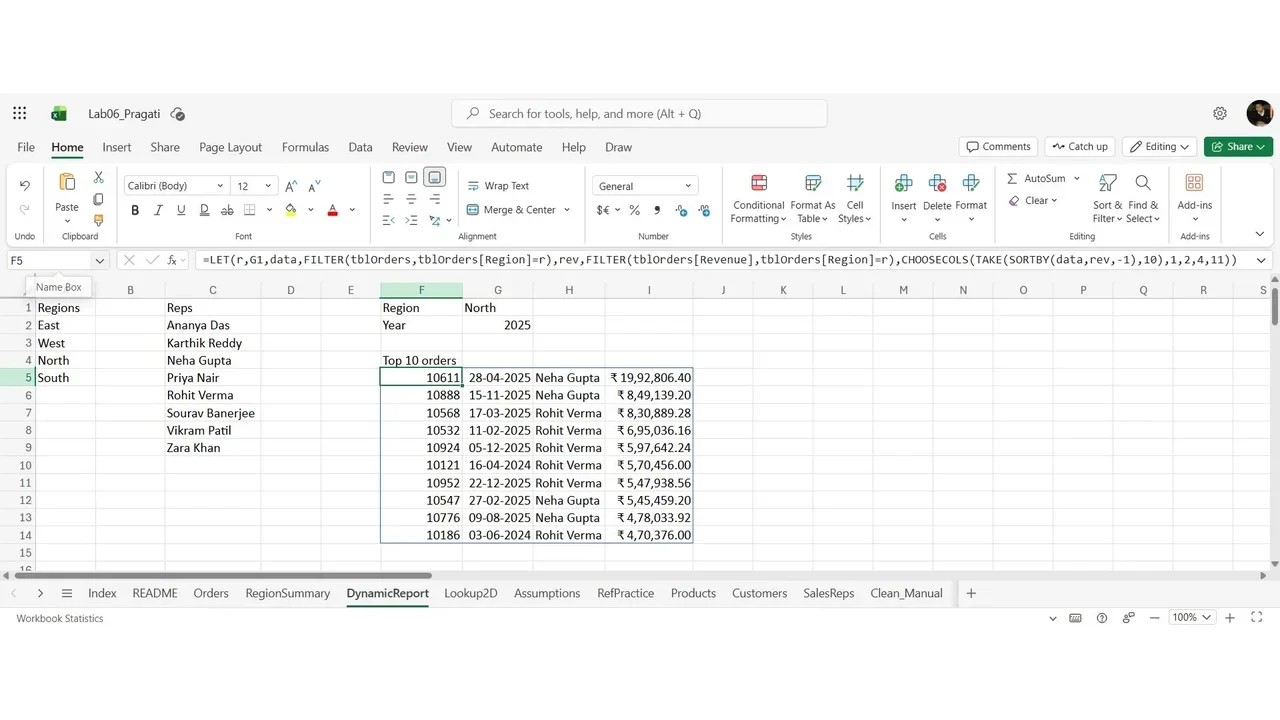
  7. Lab 6 · Dynamic Arrays - FILTER, SORT, UNIQUE, GROUPBY, PIVOTBY Subscribers

    3 sections · 23 steps · 5 to click

    Practise
  8. Lab 7 · Advanced PivotTables - Show Values As, Top 5, Slicers, GETPIVOTDATA Subscribers

    1 section · 6 steps · 1 to click

    Practise
  9. Lab 8 · Advanced Charts - Combo, Waterfall, Pareto, Histogram Subscribers

    3 sections · 13 steps · 3 to click

    Practise
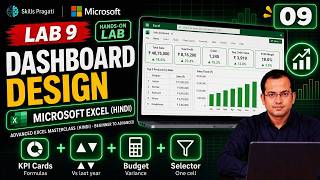
  10. Lab 9 · Dashboard Design - KPI Cards and a Year Selector Subscribers

    3 sections · 19 steps · 7 to click

    Practise
  11. Lab 10 · Power Query - Clean Once, Refresh Forever Subscribers

    1 section · 11 steps · 1 to click

    Practise
  12. Lab 15 · What-If Analysis - Financial Model, Goal Seek, Break-even Subscribers

    3 sections · 21 steps · 11 to click

    Practise
  13. Lab 16 · Statistics and Forecasting - Mean, Median, FORECAST Subscribers

    2 sections · 14 steps · 6 to click

    Practise
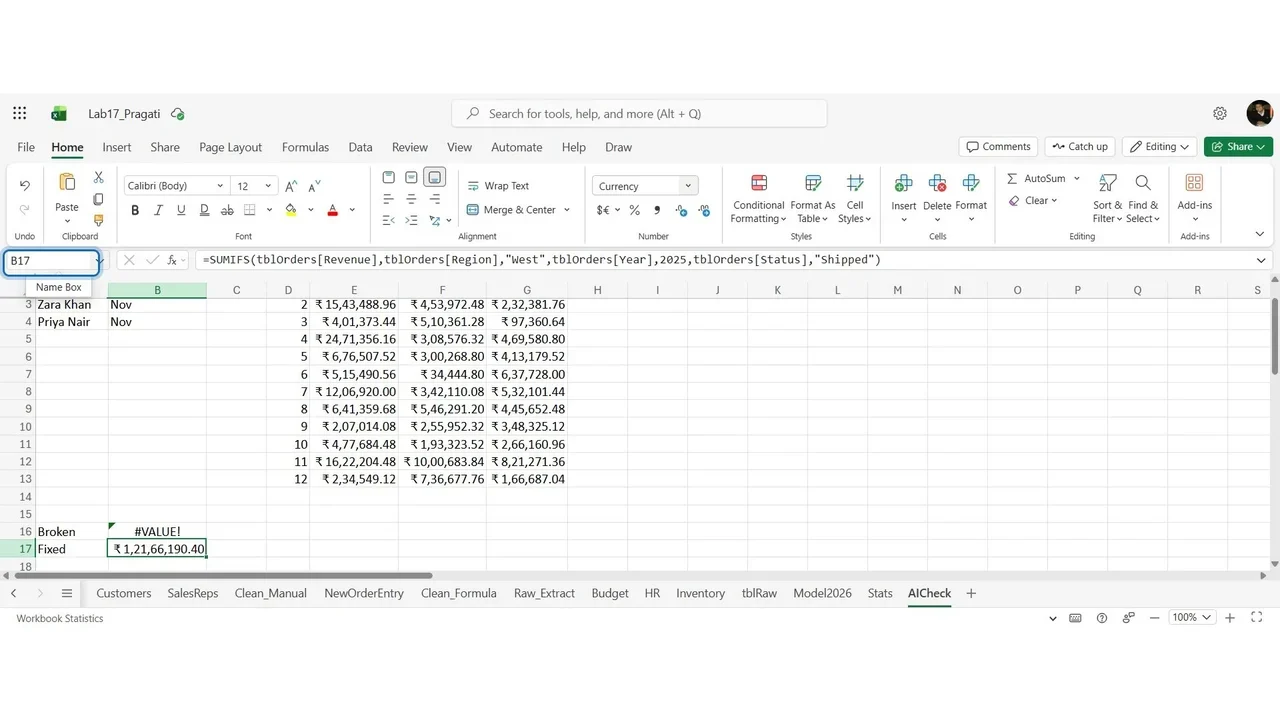
  14. Lab 17 · AI-Assisted Excel - Copilot Prompts You Can Verify Subscribers

    1 section · 7 steps · 2 to click

    Practise
  15. Lab 18 · Auditing and Troubleshooting - Errors and a Checks Sheet Subscribers

    3 sections · 18 steps · 7 to click

    Practise
  16. Lab 19 · Five Business Reporting Sprints - Sales, HR, Budget, Inventory Subscribers

    5 sections · 24 steps · 9 to click

    Practise
  17. Lab 20 · Capstone - An Automated BI Dashboard in Excel Subscribers

    2 sections · 18 steps · 8 to click

    Practise
Leader brief

What a technology leader should know about Advanced Excel Masterclass in Hindi

What it is

Advanced Excel takes one company’s workbook from a messy export to a complete BI dashboard: tables and formulas, Power Query, PivotTables, Power Pivot and DAX, what-if models and AI-assisted Excel (taught in Hindi).

Why now

Teams that master Power Query, the data model and dashboards automate reporting that otherwise takes hours each week.

Decisions you will make

  • Which repetitive reports to automate with Power Query
  • When to move from formulas to a data model with DAX
  • How reports are audited before they are shared

Risks if ignored

  • Manual copy-paste errors in business reports
  • Reports that only one person can update

Cost

Free: Excel for the web with a free Microsoft account is enough.

Who owns what

AnalystWorkbook, queries, model and dashboard
ManagerReport requirements and review

Questions to ask your team

  • Which report do we rebuild by hand every month?
  • Who checks the numbers before they go out?
Course videos

All 22 videos, in order

Playlist on YouTube
  1. 16:34Advanced Excel Masterclass: Course Overview and Final Dashboard DemoOverview
  2. 27:34Lab 0: Course Folder and Practice Workbook in OneDriveHands-on
  3. 314:29Lab 1: Excel Tables, Calculated Columns, Named Ranges and $ ReferencesHands-on
  4. 419:51Lab 2: Clean Messy Data - Remove Duplicates, Flash Fill, Data ValidationHands-on
  5. 510:17Lab 3: IF, IFS, SWITCH and LET - Business Rules in FormulasHands-on
  6. 611:36Lab 4: XLOOKUP, INDEX MATCH and Two-Way LookupsHands-on
  7. 79:54Lab 5: Text, Date and SUMIFS / COUNTIFS FunctionsHands-on
  8. 88:52Lab 6: Dynamic Arrays - FILTER, SORT, UNIQUE, GROUPBY, PIVOTBYHands-on
  9. 911:32Lab 7: Advanced PivotTables - Show Values As, Top 5, Slicers, GETPIVOTDATAHands-on
  10. 109:15Lab 8: Advanced Charts - Combo, Waterfall, Pareto, HistogramHands-on
  11. 1110:43Lab 9: Dashboard Design - KPI Cards and a Year SelectorHands-on
  12. 126:21Lab 10: Power Query - Clean Once, Refresh ForeverHands-on
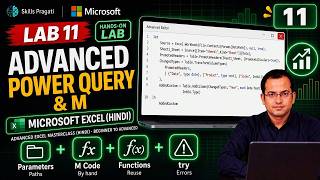
  13. 134:33Lab 11: Advanced Power Query and M - Parameters, Custom FunctionsHands-on
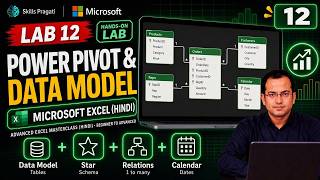
  14. 147:36Lab 12: Power Pivot and the Data Model - Star SchemaHands-on
  15. 156:34Lab 13: DAX Measures - SUM, CALCULATE, Time IntelligenceHands-on
  16. 165:03Lab 14: Macros, VBA and Office Scripts - One-Click ReportsHands-on
  17. 1713:32Lab 15: What-If Analysis - Financial Model, Goal Seek, Break-evenHands-on
  18. 1811:32Lab 16: Statistics and Forecasting - Mean, Median, FORECASTHands-on
  19. 198:38Lab 17: AI-Assisted Excel - Copilot Prompts You Can VerifyHands-on
  20. 2010:14Lab 18: Auditing and Troubleshooting - Errors and a Checks SheetHands-on
  21. 219:33Lab 19: Five Business Reporting Sprints - Sales, HR, Budget, InventoryHands-on
  22. 228:09Lab 20: Capstone - An Automated BI Dashboard in ExcelHands-on

More in Excel & Productivity

Excel & ProductivityBeginner to Advanced

Excel Dashboard Masterclass

Turn four thousand rows of messy sales data into an interactive dashboard a manager reads in ten seconds: cleaning, XLOOKUP and SUMIFS, PivotTables, charts, KPI cards and slicers.

  • Hands-on lab
  • Practice sim
  • Mock exam

11 videos1.4 h8 practice labs

Watch on YouTube